Edit chart
Loading graph
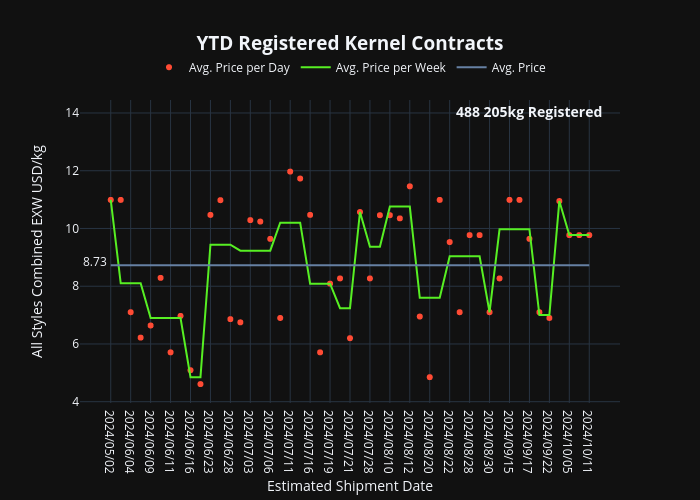
Gerhardmacsm.org's interactive graph and data of "YTD Registered Kernel Contracts" is a scatter chart, showing Avg. Price per Day, Avg. Price per Week, Avg. Price; with Estimated Shipment Date in the x-axis and All Styles Combined EXW USD/kg in the y-axis.. The x-axis shows values from -2.911764705882353 to 50.911764705882355. The y-axis shows values from 3.780120481927711 to 14.45. This visualization has the following annotations: 488 205kg Registered; 8.73